Blog · From research note 4
~3× faster linear-attention kernels than packed FP32 at batch 512
45% more serving throughput than SGLang’s FP32 default, with our implementation of LeapQuant: 8-bit quantization of the recurrent state of linear attention.
One experiment among five. FastPath studies how a request becomes tokens, one mechanism at a time, each against a bar set before the run. This post reports one of those experiments. It is not a product announcement, and it does not yet clear the bar we set for it. We publish it now, with what does not look good, because that is how we publish every result.
Newer language models mix two kinds of layer. Attention layers keep a cache that grows with every token. Linear-attention layers keep a running state of fixed size for every request, and every decode step reads and writes all of it. In Qwen3.5-9B that state is a 128 by 128 matrix per head, in 24 of the model’s 32 layers.
LeapQuant, by Yi Pan and colleagues [1], stores this state in 8 bits. We implemented it from the paper, wrote our own GPU kernels, put it inside the SGLang serving engine, and measured it with Qwen3.5-9B on one GPU. This post reports what we measured, including the parts that do not look good yet.
The result in one paragraph
At 512 concurrent requests, LeapQuant produced about 45% more output tokens per second than SGLang’s default, the fp32 state. Against SGLang’s own faster setting, a 16-bit state with a window, it was 4% ahead, and its tail latency was worse. So most of the gain over the default comes from leaving fp32, and the rest is small so far. Whether the 16-bit setting is a fair baseline depends on its accuracy, which we have not yet tested on hard tasks.
What LeapQuant does
Rounding a running state to 8 bits after every token destroys it, because each rounding error feeds the next step. The paper avoids that in three ways.
- It rounds once per window. Recent token updates are buffered at higher precision. The state is rounded only when the window is full. We use a window of 16 tokens and call that step the fold.
- It keeps the outliers apart. A few high-precision vectors, the compensator tokens, hold the largest parts of the state.
- It smooths the rest before rounding. Scales per row keep a few large entries from setting the step size for all the others.
The stored state takes 1.19 bytes per entry, against 2 for a 16-bit state and 4 for fp32. Our second post explains in detail how the state is stored, read, folded and served. Technical note 9 explains why a recurrent state is harder to round than a KV cache.
Serving results
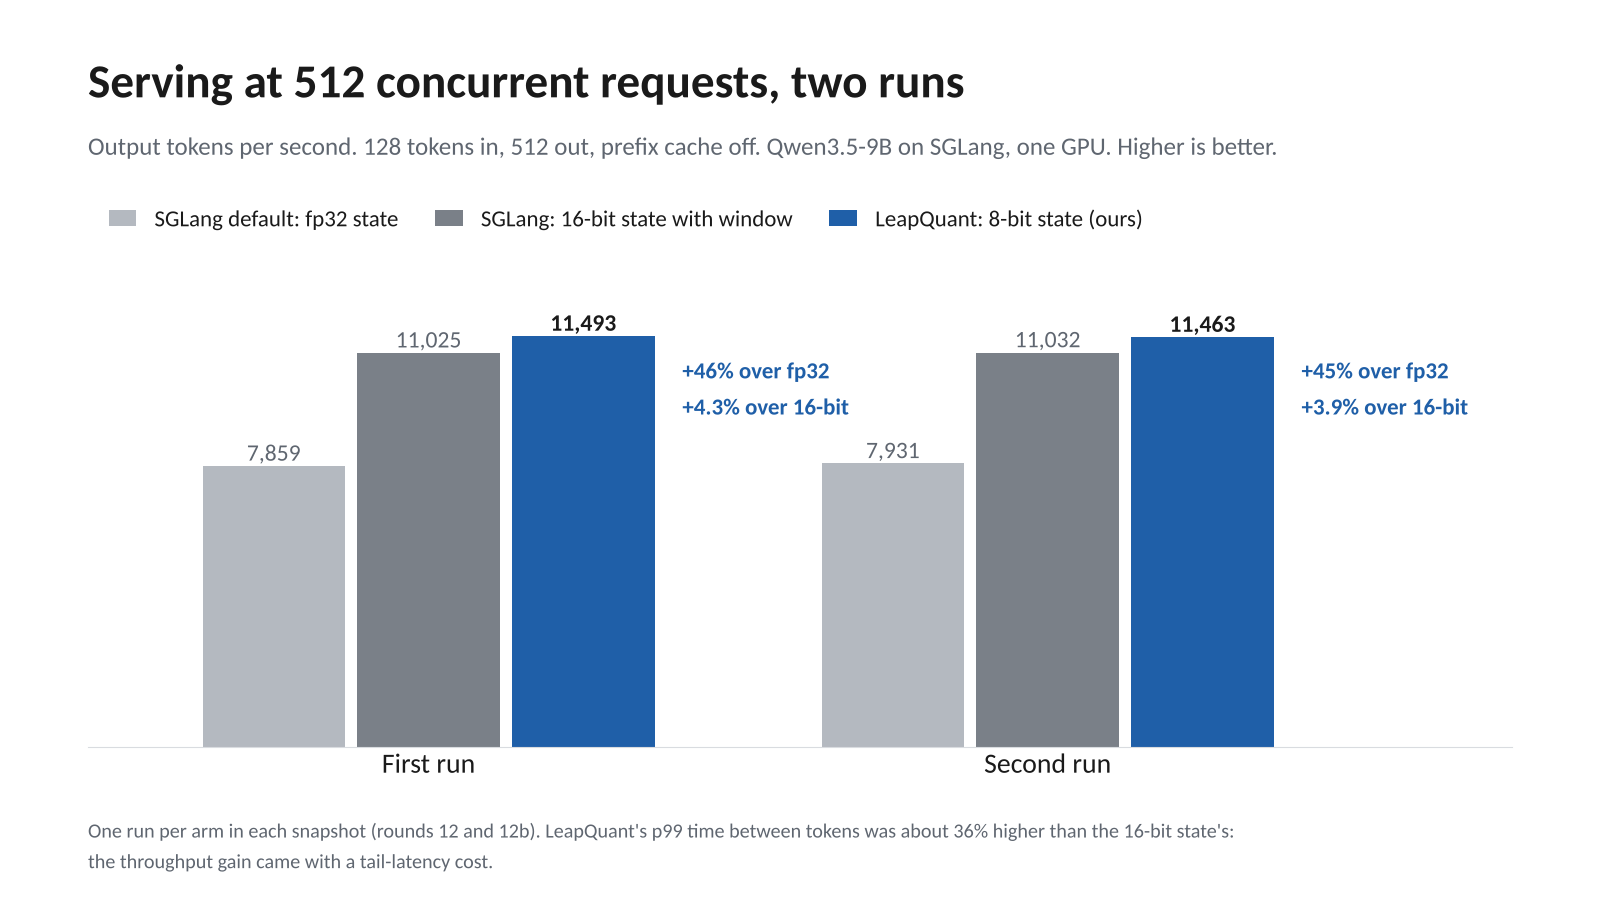
In two runs LeapQuant reached 11,493 and 11,463 output tokens per second. The fp32 default reached 7,859 and 7,931. The 16-bit state reached 11,025 and 11,032. That is 1.46 and 1.45 times the default, and 4.3% and 3.9% above the 16-bit state.
The gain has a cost. LeapQuant’s p99 time between tokens was about 70 ms against 51 ms for the 16-bit state. A throughput chart alone would hide that, which is why we judge results on goodput at a latency target (research note 5).
At the same hourly price, a throughput gain of s lowers the cost per token by 1 − 1/s. So 4% more throughput is about 3.8% lower cost per output token, and 45% more is about 31% lower. These are arithmetic on our measured ratios, not a measured bill.
The gain depends on load
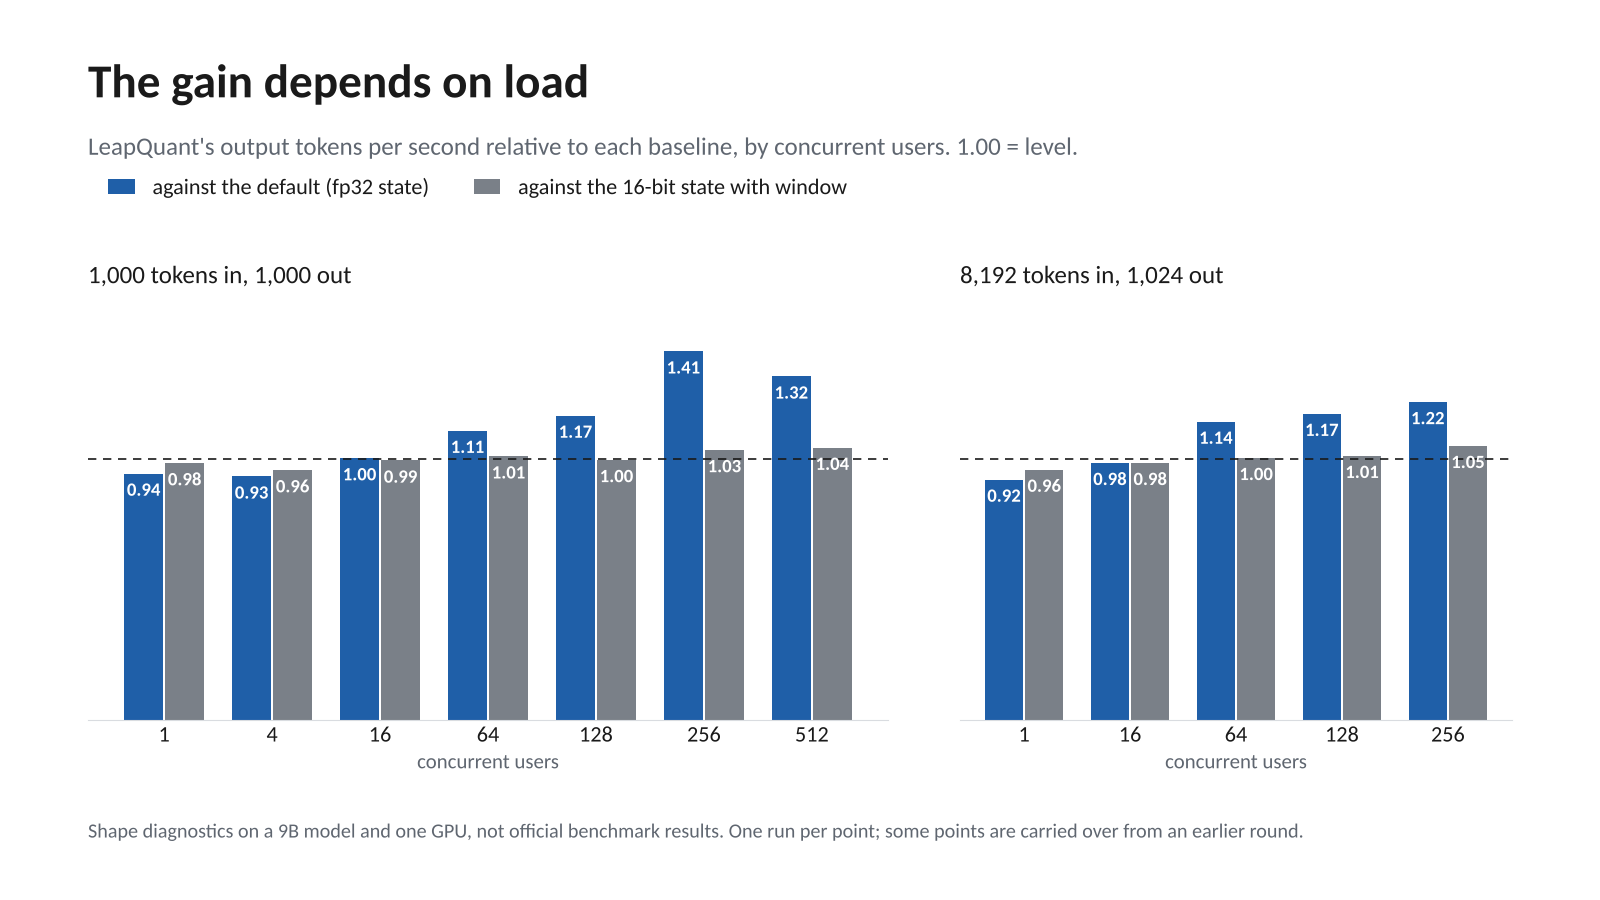
With 1,000 tokens in and 1,000 out, LeapQuant was 6% to 7% slower than the default at 1 to 4 users, level at 16, and 11% to 41% faster from 64 users up. Against the 16-bit state it ranged from 4% behind at low load to 4% ahead at high load.
An 8-bit state pays when many requests share the GPU, because that is when the state is a large part of what each step moves. At low load our implementation is slower than both baselines, and we do not yet know why.
The kernel
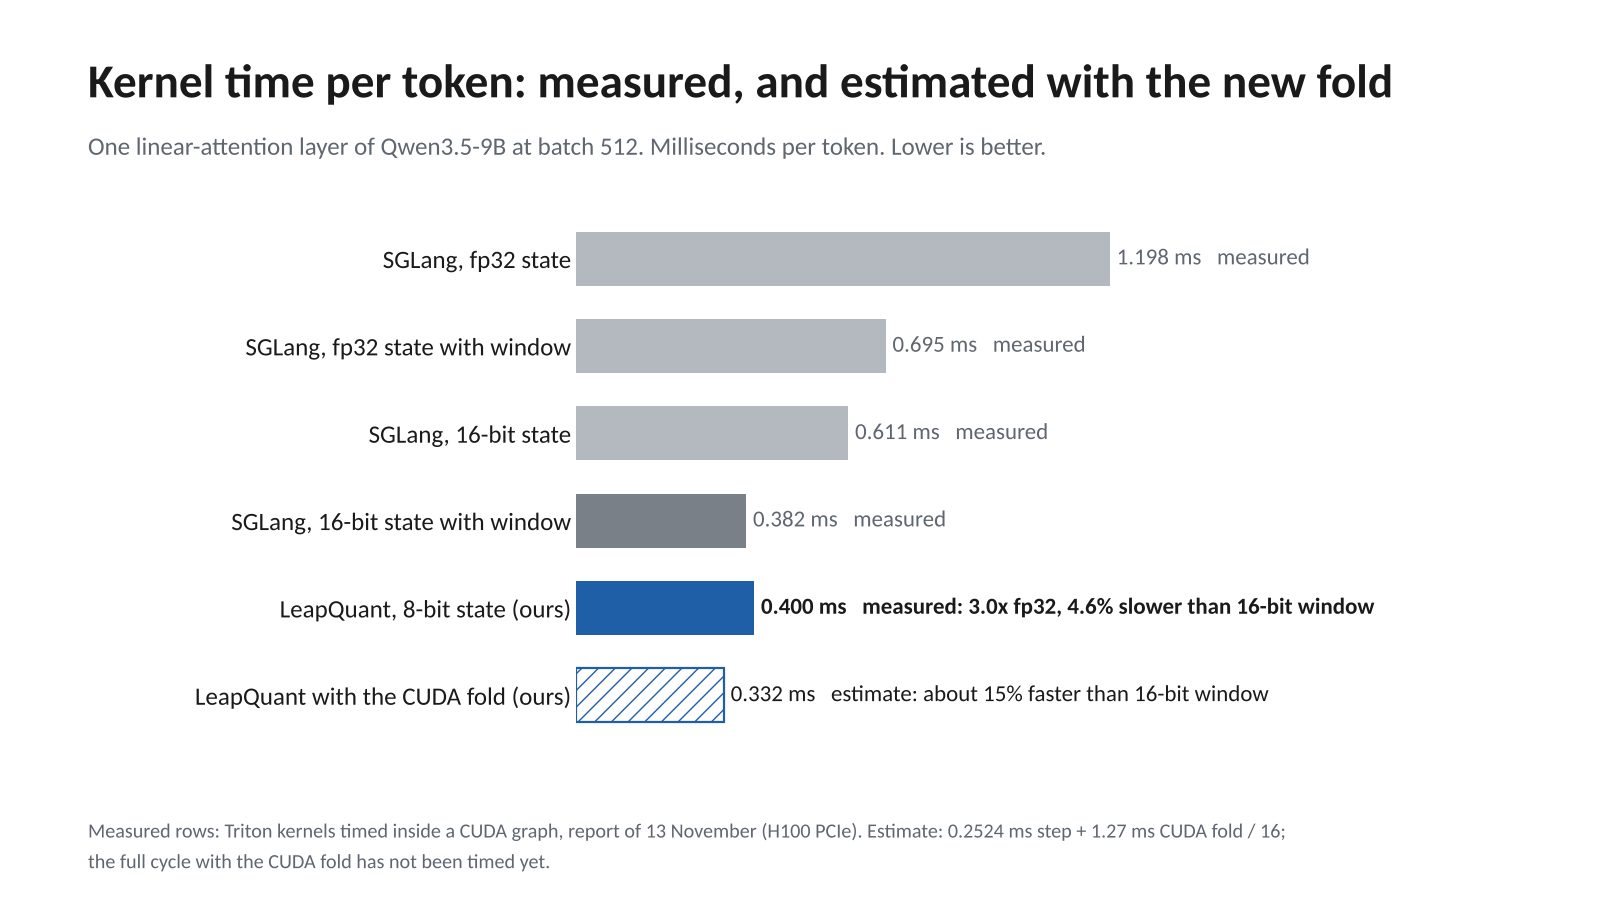
Measured inside a CUDA graph, our Triton kernels take 0.400 ms per token for one layer at batch 512, counting one fold every 16 steps. That is 3.0 times faster than SGLang’s fp32 kernel. It is also 4.6% slower than SGLang’s 16-bit window kernel. Two days earlier our first kernel was 7.2 times slower than the window kernel; research note 4 records where that time went.
We have since written the fold in CUDA. It takes 1.27 ms for 512 requests where the Triton fold took 2.36 ms. If the rest of the step is unchanged, the layer takes about 0.332 ms per token, which would be 15% faster than the 16-bit window kernel. That figure is an estimate. We have not yet timed the full cycle on one build.
Tail latency and fold scheduling
Every 16th token a request folds. Requests that start together fold on the same step, and that step takes longer than the others. We believe that is where the tail comes from, though our aggregate tables cannot prove it.
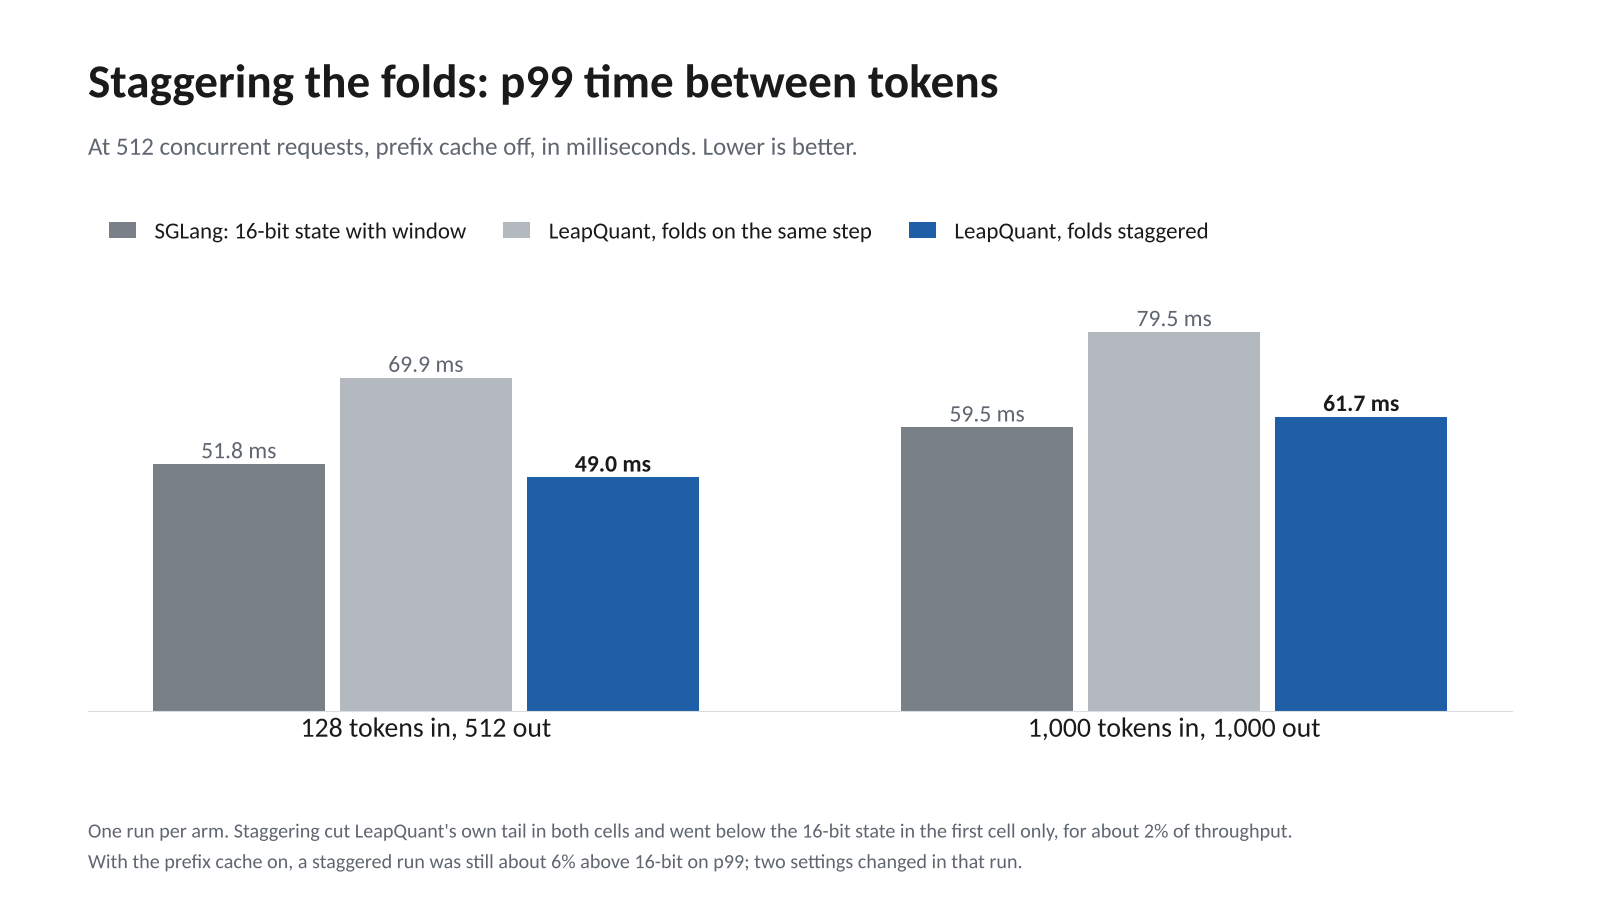
Staggering the folds is the obvious remedy, and the first test is encouraging. On the decode-heavy shape it cut LeapQuant’s p99 from 69.9 ms to 49.0 ms, below the 16-bit state’s 51.8 ms, for about 2% of throughput. On the second shape it cut the tail too but stayed above the 16-bit state. With the prefix cache on, a staggered run was still about 6% above 16-bit. Each of these is one run.
Accuracy
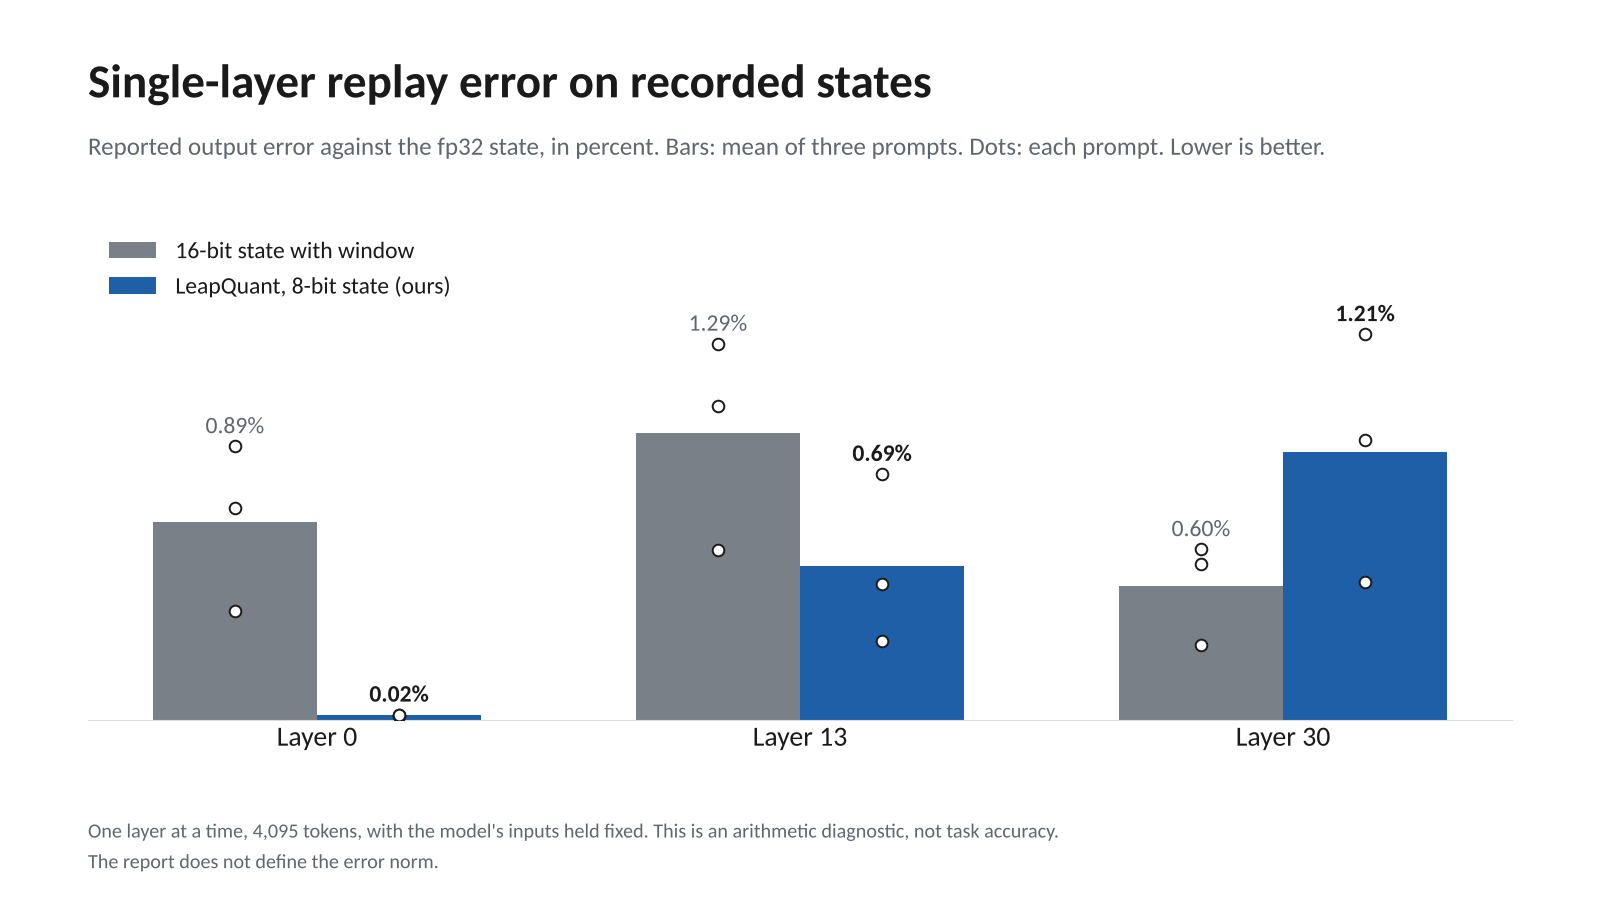
On recorded states, replayed one layer at a time, LeapQuant is at least as accurate as the 16-bit state on 6 of 9 traces. It is far better in the early layers and worse in layer 30.
On tasks, LeapQuant passes our one-point noninferiority test against fp32 on MMLU-Pro: 67.0% against 65.6%. On GSM8K the result is inconclusive: 93.5% against 94.0%, with an interval too wide to decide. Inconclusive is not the same as equivalent.
One thing matters more than the rest. The paper reports that a plain 16-bit state loses 11.5 points on average on hard reasoning and coding tasks, while LeapQuant matches fp32. Our short tests show no such gap for the 16-bit state with a window. We have not run the paper’s tasks. If the windowed 16-bit state also loses accuracy there, it is not a fair baseline, and the comparison that counts is the one against fp32. That run decides the headline of this experiment, so it is the first quality task.
What we are not claiming
- A reproduction of the paper. Its kernel results are on B200, RTX PRO 6000 and RTX 5090 GPUs, and its serving results are in vLLM. Ours are in SGLang on one GPU with short fixed-length requests.
- A repeated result. Most numbers here come from one run per arm. Two runs of one point differed by several percent.
- An official benchmark result. Two request shapes follow public benchmarks. The model, the system and the method are ours.
- Fully documented hardware. Our earlier reports record an H100 PCIe. The later ones do not record the GPU.
- Production readiness or unchanged quality.
What comes next
- Time the full kernel cycle with the CUDA fold on one build.
- Run the paper’s tasks on four state formats: fp32, 16-bit, 16-bit with a window, and LeapQuant.
- Repeat the serving comparisons as paired runs, with every byte of GPU memory accounted for.
- Measure quality at long context: loss by position, exact recall, and code completion with a repository in context.
- Find the cost at low load, and settle the fold schedule with the prefix cache on and off.
Each of these will be announced on the blog when its evidence exists, and folded into research note 4. The other four lines of the program continue alongside it.
References
- Y. Pan, H. Xi, K. Zhu, et al. LeapQuant: Efficient Linear Attention with Accurate Recurrent State Quantization. arXiv:2609.38166, 2026. Project page: leapquant.github.io.
The method is the authors’. The implementation and the measurements in this post are ours. Write to us about this experiment.